31

2014-review-Next-generation sequencing to guide cancer therapy


 This reductionist thinking led the initial theories on carcinogenesis to be centered on how many “hits” or genetic mutations were necessary for a tumor to develop.
还原论者认为导致癌症发生发展的原因集中在一些必须因子-"hit" or genetic mutations
由于这个假设,早期探索多种癌症的遗传基础的方法主要是低通量的研究具体某些特定的基因或者变异情况。
分析方法的选择:microarray vs WGS vs WES
临床样品的选择:fresh frozen tissue  / FFPE specimens /CTCs / ctDNA
临床NGS数据分析方法:mapping --> SNVs CNVs and SVs --> annotation
挑战:1,低频突变很难从测序错误中区分开
            2,很多临床相关的DNA fushions发生在非编码区,所以WES也会错过不少信息的
临床NGS数据注释 :多种数据库,多种数据分析方法
NGS辅助临床医疗的三个途径: 1, diagnosis,早期诊断,精确分类 2,针对性治疗3,耐药性,及时换药
CTC: Circulating tumor cell;
ctDNA: circulating tumor DNA;
 FDA: Food and Drug Administration;
FFPE: Formalin-fixed, paraffin-embedded;
MATCH: Molecular Analysis for Therapy Choice;
MHC: Majorhistocompatibility complex;
NGS: Next-generation sequencing;
SNV: Singlenucleotide variant;
TCGA: The Cancer Genome Atlas.
31

文献笔记-2015-nature-molecular analysis of gastric cancer新的分类及预后调查

文献:Molecular analysis of gastric cancer identifies subtypes associated with distinct clinical outcomes

A small pre-defined set of gene expression signatures

epithelial-to-mesenchymal transition (EMT)  上皮细胞向间充质细胞转化
microsatellite instability (MSI) 微卫星不稳定性
cytokine signaling 细胞因子信号
cell proliferation  细胞增殖
DNA methylation DNA甲基化
TP53 activity TP53活性
gastric tissue 胃组织


经典的分类方法是:Gastric cancer may be subdivided into 3 distinct subtypes—proximal, diffuse, and distal gastric cancer—based on histopathologic and anatomic criteria. Each subtype is associated with unique epidemiology.

我们用主成分分析Principal component anaylsis (PCA)

PC1

PC2

PC3

这三个主成分与上面的七个特征是相关联的。

根据我们的主成分分析,可以把我们的300个GC样本分成如下四组,命名如下:

Gene expression signatures define four molecular subtypes of GC:

MSI (n = 68),

MSS/EMT (n = 46),

MSS/TP53+ (n = 79)

MSS/TP53− (n = 107)

然后用本文的分类方法,测试了另外另个published数据,还是分成四个组

(MSI, MSS/EMT, MSS/TP53+ and MSS/TP53-)

分别是TCGA数据库的;n = 46, n = 62, n = 50 and n = 47.

Singapore的研究; n = 12, n = 85, n = 39 and n = 63 respectively

我们这样的分组可以得到一些规律:

(i) The MSS/EMT subtype occurred at a significantly younger age (P = 3e-2) than did other subtypes. The majority (>80%) of the subjects in this subtype were diagnosed with diffuse-type (P < 1e-4) at stage III/IV(P = 1e-3).

(ii) The MSI subtype occurred predominantly in the antrum (75%), >60% of subjects had the intestinal subtype, and >50% of subjects were diagnosed at an early stage (I/II).

(iii) Epstein-Barr virus (EBV) infection occurred more frequently in the MSS/TP53+ group (n = 12/18, P = 2e-4) than in the other groups.


然后我们对我们的300个样本做了生存分析:

预后: MSI  >   MSS/TP53+    >   MSS/TP53 >  MSS/EMT

Next, we validated the survival trend of GC subtypes in three independent cohorts: Samsung Medical Center cohort 2 (SMC-2,n = 277, GSE26253)31,

Singapore  cohort(n = 200, GSE15459)21 and

TCGA gastric cohort (n = 205).

We saw that the GC subtypes showed a significant association with overall survival

结论:我们这样的分类是最合理的,跟各个类别的预后非常相关。


然后我们看看突变模式:

the MSI~ hypermutation ~KRAS (23.3%), the PI3K-PTEN-mTOR pathway (42%), ALK (16.3%) and ARID1A (44.2%)18.

We observed enrichment of PIK3CA H1047R mutations in the MSI samples

we saw enrichment of E542K and E545K mutations in MSS tumors

The EMT subtype had a lower number of mutation events when compared to the other MSS groups(P = 1e−3).

The MSS/TP53− subtype showed the highest prevalence of TP53 mutations (60%), with a low frequency of other mutations

the MSS/TP53+ subtype showed a relatively higher prevalence (compared to MSS/TP53−) of mutations in APC, ARID1A, KRAS, PIK3CA and SMAD4.

再看看拷贝数变异情况:

再看看与另外两个研究团队的分类情况的比较

The TCGA study reported expression clusters (subtypes named C1–C4) and genomic subtypes (subtypes named EBV+, MSI, Genome Stable (GS) and Chromosomal Instability (CIN)).

A follow-up study of the Singapore cohort21 described three expression subtypes (Proliferative, Metabolic and Reactive)

However, a consensus on clinically relevant subtypes that encompasses molecular heterogeneity and that can be used in preclinical and clinical research has not been reported.

Here we report the molecular classification of GC linked not only to distinct patterns of genomic alterations, but also to recurrence pattern and prognosis across multiple GC cohorts.


microsatellite instability

英文简称 : MI
中文全称 : 微卫星不稳定性
所属分类 : 生物科学
词条简介 : 微卫星不稳定性(microsatellite instability,MI)检测是基于VNTR的发现,细胞内基因组含有大量的碱基重复序列,一般将6-7bp的串联重称为小卫星DNA(minisatellite DNA),又称为VNTR。而将1-4bp的串联重复称为微卫星DNA,又称简单重复序列(simple repeat sequence,SRS)。SRS是一种最常见的重复序列之一,具有丰富的多态性、高度杂合性、重组纺低等优点。最常见的为双核苷酸重复,即(AC)n和(TG)n。研究表胆,在n≥104时,2bp重复序列在人群中呈高度多态性。SRS广泛存在于原核和真核基因组中,约占真核基因组的5%,是近年来快速发展起来的新的DNA多态性标志之一。策卫星稳定性(MI)是指简重复序列的增加或丢失。MI首先在结肠癌中观察到,1993年在HNPCC中观察到多条染色体均有(AC)n重复序列的增加或毛失,以后相继在胃癌、胰腺癌、肺癌、膀胱癌、乳腺癌、前列腺癌及其他肿瘤等也好现存在微卫星不稳定现象,提示MI可能是肿瘤细胞的另一重要分子结果显示 ,MI与肿瘤与发展有关,MI仅在肿瘤细胞中发现,从未在正常组织中检测到。在原发与移肿瘤中,MI均交分布于整个肿瘤。晚期胃癌的MI频率显著高于早期胃癌。


31

文献笔记-2010-R-softeware-identify-cancer_driver_genes

我们用188 non-small cell lung tumors数据来测试了一个R语言程序,find driver genes in cancer ~
软件地址如下:http://linus.nci.nih.gov/Data/YounA/software.zip
这是一个R语言程序,里面有readme,用法很简单。
准备好两个文件,分别是silent_mutation_table.txt and nonsilent_mutation_table.txt ,它们都是普通文本格式数据,内容如下,就是把找到的snp格式化,根据注释结果分成silent和nonsilent即可。
#Ensembl_gene_id Chromosome Start_position Variant_Type Reference_Allele Tumor_Seq_Allele1 Tumor_Seq_Allele2 Tumor_Sample_Barcode
#ENSG00000122477 1 100390656 SNP G G A TCGA-23-1022-01A-02W-0488-09
然后直接运行程序包里面的主程序,在R语言里面source("main_R_script.r")
We reanalyzed sequence data for 623 candidate genes in 188 non-small cell lung tumors using the new method.
to identify genes that are frequently mutated and thereby are expected to have primary roles in thedevelopment of tumor
To find these driver genes, each gene is tested for whether its mutation rate is significantly higher than the background (or passenger) mutation rate.

Some investigators (Sjoblom et al., 2006) further divide mutations into several types according to the nucleotide and the neighboring nucleotides of the mutations.

Ding et al. (2008)的方法的三个缺点:
1、different types of mutations can have different impact on proteins.(越影响蛋白功能的突变,越有可能是driver mutation)
2、different samples have different background mutation rates. (在高突变背景的样本中的突变,很可能是高突变背景的原因,而不是因为癌症)
3、a different number of non-silent mutations can occur at each base pair according to the genetic code.(比如Tryptophan仅仅只有一个密码子,而arginine高达6个密码子)

我们提出的方法的4个优点是:
1,我们对非同义突变根据它们对蛋白功能的影响进行了评级打分。
2,我们允许不同的样品有着不同的BMR
3,that whether the mutation is non-silent or silent depends on the genetic code
4,we take into account uncertainties in the background mutation rate by using empirical Bayes methods

还有5个需要改进的地方:
1,However, the functional impact is also dependent on the position in which a mutation occurs.(我们仅仅考虑了突变对氨基酸的改变)
2,the current scoring system which assigns mutation scores in the order: missense mutation<inframe indel<mutation in splice sites<frameshift indel=nonsense mutation may be biased toward identifying tumor suppressor genes over oncogenes.
3,we may refine our background mutation model in Table 1 so that all six types of mutations, A:T→G:C, A:T→C:G, A: T→T :A,G:C→A:T, G:C→T :A, G:C→C:G have separate mutation rates.
4,we did not take into account correlations among mutations in identifying driver genes.
5,one might combine both copy number variation and sequencing data to identify driver genes.

HGNC定义的gene Symbol转为ensemble数据库的ID,的R语言代码:
library(biomaRt)
ensembl=useMart("ensembl",dataset = "hsapiens_gene_ensembl")
all.gene.table = read.table("all_gene.symbol", header=F)
convert=getBM(attributes = c("chromosome_name","ensembl_gene_id","hgnc_symbol"),filters =c("hgnc_symbol"),values=all.gene.table[,1],mart=ensembl)
chromosome=c(1:22,"X","Y","M")
convert=convert[!is.na(match(convert[,1],chromosome)),2:3] #remove names whose matching chromosome is not 1-22, X, or Y.
convert=convert[rowSums(convert=="")==0,]
write.table(convert,"ensembl2symbol.list",quote = F,row.names =F,col.names =F)
write.table(convert,"all_gene_name.txt",quote = F,row.names =F,col.names =F)

一个gene Symbol可能对应着多个ensemble ID号,但是在每个染色体上面是一对一的关系。
有些gene Symbol可能找不到ensemble ID号,一般情况是因为这个gene Symbol并不是纯粹的HGNC定义的,或者是比较陈旧的ID。
比如下面的TIGAR ,就很可能被写作是C12orf5
Aliases for TIGAR Gene
TP53 Induced Glycolysis Regulatory Phosphatase 2 3
TP53-Induced Glycolysis And Apoptosis Regulator 2 3 4
C12orf5 3 4 6
Probable Fructose-2,6-Bisphosphatase TIGAR 3
Fructose-2,6-Bisphosphate 2-Phosphatase 3
Chromosome 12 Open Reading Frame 5 2
Fructose-2,6-Bisphosphatase TIGAR 3
Transactivated By NS3TP2 Protein 3
EC 3.1.3.46 4
FR2BP 3
External Ids for TIGAR Gene
HGNC: 1185 Entrez Gene: 57103 Ensembl: ENSG00000078237 OMIM: 610775 UniProtKB: Q9NQ88
Previous HGNC Symbols for TIGAR Gene
C12orf5
Export aliases for TIGAR gene to outside databases

29

研究癌症领域必看文献

最近需要了解一些癌症相关知识,看到了这个文献列表,觉得非常棒,所以推荐给大家。

抽时间慢慢看,一个月应该可以把这些文献看完的。

癌症种类大全 http://www.cancer.gov/types
癌症药物大全 http://www.cancer.gov/about-cancer/treatment/drugs
癌症所有的信息几乎都能在这个网站上面找到 http://www.cancer.gov/
包括癌症的科普、treatment、diagnosis,prognosis,classification,drugs、prediction等等

different_kinds_of_cancer_in_CCLE

Cancer Precision Medicine: Improving Evidence in Practice - August 24, 2015

NCI-MATCH Trial Opens,External Web Site Icon AACR blog post, August 2015

NCI-MATCH launch highlights new trial design in precision-medicine eraExternal Web Site Icon
McNeal C , JNCI, August 2015

The Cancer Genomics Resource List, 2014External Web Site Icon
Zutter MM et al. CAP Lab Improvement Program,Archives of Pathology, August 2015

Personalized medicine and economic evaluation in oncology: all theory and no practice?External Web Site Icon
Garattini L et al. Expert Rev Pharmacoecon Outcomes Res 2015 Aug 9. 1-6

Precision medicine trials bring targeted treatments to more patients,External Web Site Icon C. Helwick, ASCO Post, Jul 25

Next-generation sequencing to guide cancer therapy External Web Site Icon
Gagan J et al, Genome Medicine, July 29, 2015

Feasibility of large-scale genomic testing to facilitate enrollment onto genomically matched clinical trials.External Web Site Icon
Meric-Bernstam F et al. J. Clin. Oncol. 2015 May 26.

Brave-ish new world-what's needed to make precision oncology a practical reality.External Web Site Icon
MacConaill LE et al. JAMA Oncol 2015 Jul 16.

Genomic profiling: Building a continuum from knowledge to careExternal Web Site Icon
Helen C et al. JAMA Oncology, July 2015

Are we there yet?External Web Site Icon
When it comes to curing cancer, targeted therapies and genomic sequencing are helping, but we still have far to go. Genome Magazine, June 29, 2015

Artificial intelligence, big data, and cancerExternal Web Site Icon
Kantarjian H et al, JAMA Oncology, June 2015

Multigene panel testing in oncology practice - how should we respond?External Web Site Icon
Kurian AW et al. JAMA Oncology, June 2015

Use of whole genome sequencing for diagnosis and discovery in the cancer genetics clinic.External Web Site Icon
Foley SB et al. EBioMedicine 2015 Jan 2(1) 74-81

The future of molecular medicine: biomarkers, BATTLEs, and big data External Web Site Icon
ES Kim, ASCO University, June 2015

NCI-MATCH trial will link targeted cancer drugs to gene abnormalitiesExternal Web Site Icon

Targeted agent and profiling utilization registry study,External Web Site Icon from the American Society for Clinical Oncology

ASCO study aims to learn from patient access to targeted cancer drugs used off-label,External Web Site Icon American Society for Clinical Oncology

Improving evidence developed from population-level experience with targeted agents Adobe PDF file [PDF 462.93 KB]External Web Site Icon
McLellan M et al Issue Brief. Conference on Clinical Cancer Research November 2014

Implementing personalized cancer care.External Web Site Icon
Schilsky RL et al. Nat Rev Clin Oncol 2014 Jul (7) 432-8

Accelerating the delivery of patient-centered, high-quality cancer care.External Web Site Icon
Abrahams E et al. Clin. Cancer Res. 2015 May 15. (10) 2263-7

Next-generation clinical trials: Novel strategies to address the challenge of tumor molecular heterogeneity.External Web Site Icon
Catenacci DV et al. Mol Oncol 2015 May (5) 967-996

Cancer Precision Medicine: Improving Evidence in Practice - May 29, 2015

Diagnosis and treatment of cancer using genomicsExternal Web Site Icon
Vockley JG et al. BMJ, May 28, 2015

Targeted agent and profiling utilization registry study,External Web Site Icon from the American Society for Clinical Oncology

ASCO study aims to learn from patient access to targeted cancer drugs used off-label,External Web Site Icon American Society for Clinical Oncology

Improving evidence developed from population-level experience with targeted agents Adobe PDF file [PDF 462.93 KB]External Web Site Icon
McLellan M et al Issue Brief. Conference on Clinical Cancer Research November 2014

Implementing personalized cancer care.External Web Site Icon
Schilsky RL et al. Nat Rev Clin Oncol 2014 Jul (7) 432-8

Accelerating the delivery of patient-centered, high-quality cancer care.External Web Site Icon
Abrahams E et al. Clin. Cancer Res. 2015 May 15. (10) 2263-7

Next-generation clinical trials: Novel strategies to address the challenge of tumor molecular heterogeneity.External Web Site Icon
Catenacci DV et al. Mol Oncol 2015 May (5) 967-996

Precision Medicine: Cancer and Genomics - May 12, 2015

Promise, peril seen in personalized cancer therapy,External Web Site Iconby Marie McCullough, Philadelphia Inquirer, May 10

A decision support framework for genomically informed investigational cancer therapy.External Web Site Icon
Meric-Bernstam F et al. J. Natl. Cancer Inst. 2015 Jul (7)

Divide and conquer: The molecular diagnosis of cancer,External Web Site Icon by Louis M. Staudt, National Cancer Insitute, Apr 13

Health: Make precision medicine work for cancer careExternal Web Site Icon
To get targeted treatments to more cancer patients pair genomic data with clinical data, and make the information widely accessible, Mark A. Rubin. Nature News, Apr 15

Using somatic mutations to guide treatment decisionsExternal Web Site Icon
Horlings H et al. JAMA Oncology, March 12, 2015

The landscape of precision cancer medicine clinical trials in the United StatesExternal Web Site Icon
Roper N et al. Cancer Treatment Reviews 2015

What is “precision medicine?External Web Site Icon Information from the National Cancer Institute

Impact of cancer genomics on precision medicine for the treatment of cancer,External Web Site Icon from the Cancer Genome Atlas, NCI

US precision-medicine proposal sparks questions,External Web Site Icon by Sara Reardon, Nature News, Jan 22

Obama's 'precision medicine' means gene mapping,External Web Site IconNBC News, Jan 21

What is President Obama's 'precision medicine' plan, and how might it help you?External Web Site Icon By Lenny Bernstein, Jan 21

Recent reviews

Companion diagnostics: the key to personalized medicine.External Web Site Icon
Jørgensen JT. Expert Rev Mol Diagn. 2015 Feb;15(2):153-6

Promoting precision cancer medicine through a community-driven knowledgebase.External Web Site Icon
Geifman N, et al. J Pers Med. 2014 Dec 15;4(4):475-88.

Toward a prostate cancer precision medicine.External Web Site Icon
Rubin MA. Urol Oncol. 2014 Nov 20.

Prioritizing targets for precision cancer medicine.External Web Site Icon
Andre F, et al. Ann Oncol. 2014 Dec;25(12):2295-303

Toward precision medicine with next-generation EGFR inhibitors in non-small-cell lung cancer.External Web Site Icon
Yap TA, Popat S. Pharmgenomics Pers Med. 2014 Sep 19;7:285-95.

Genomically driven precision medicine to improve outcomes in anaplastic thyroid cancer.External Web Site Icon
Pinto N, et al.  J Oncol. 2014;936285

Translating genomics for precision cancer medicine.External Web Site Icon
Roychowdhury S, Chinnaiyan AM. Annu Rev Genomics Hum Genet. 2014;15:395-415

The Cancer Genome Atlas: Accomplishments and Future - April 3, 2015

The Cancer Genome Atlas (TCGA): an immeasurable source of knowledgeExternal Web Site Icon
Tomczak K, et al. Contemp Oncol (Pozn). 2015; 19(1A): A68-A77.

The Cancer Genome Atlas' 4th Annual Scientific SymposiumExternal Web Site Icon
May 11-12 ~ Bethesda, MD

The Cancer Genome Atlas (TCGA) Data Portal External Web Site Icon
Portal provides a platform for researchers to search, download, and analyze data sets generated by TCGA

Cancer Genomics Hub: A resource of the National Cancer Institute,External Web Site Icon from the USC Genome Browser

Molecular classification of gastric adenocarcinoma: translating new insights from The Cancer Genome Atlas Research Network.External Web Site Icon
Sunakawa Y et al. Curr Treat Options Oncol 2015 Apr (4) 331

TCGA data and patient-derived orthotopic xenografts highlight pancreatic cancer-associated angiogenesis.External Web Site Icon
Gore J et al. Oncotarget 2015 Feb 25.

Radiogenomics of clear cell renal cell carcinoma: preliminary findings of The Cancer Genome Atlas-Renal Cell Carcinoma (TCGA-RCC) Imaging Research Group.External Web Site Icon
Shinagare AB et al. Abdom Imaging 2015 Mar 10.

Proteomics of colorectal cancer in a genomic context: First large-scale mass spectrometry-based analysis from the Cancer Genome Atlas.External Web Site Icon
Jimenez CR et al. Clin. Chem. 2015 Feb 26.

End of cancer-genome project prompts rethinkExternal Web Site Icon
Geneticists debate whether focus should shift from sequencing genomes to analysing function. Heidi Ledford, Nature News and Comments, January 2015

Cancer Genomics: Insights into Driver Mutations - March 10, 2015

Seek and destroy: Relating cancer drivers to therapiesExternal Web Site Icon
E. Martinez-Ledesma et al. Cell, March 9, 2015

In silico prescription of anticancer drugs to cohorts of 28 tumor types reveals targeting opportunitiesExternal Web Site Icon
C Rubio-Perez et al. Cancer Cell, March 9, 2015

MADGiC: a model-based approach for identifying driver genes in cancer. Adobe PDF file [PDF 373.56 KB]External Web Site Icon
Keegan D. Korthauer et al. Bioinformatics, January 2015

Identifying driver mutations in sequenced cancer genomes: computational approaches to enable precision medicine.External Web Site Icon
Benjamin J Raphael et al. Genome Medicine 2014

Novel recurrently mutated genes in African American colon cancers.External Web Site Icon
Guda K et al. Proc Natl Acad Sci U S A. 2015 Jan 12

Sparse expression bases in cancer reveal tumor drivers.External Web Site Icon
Logsdon BA, et al. Nucleic Acids Res. 2015 Jan 12

Patient-specific driver gene prediction and risk assessment through integrated network analysis of cancer omics profiles.External Web Site Icon
Bertrand D, et al. Nucleic Acids Res. 2015 Jan 8

Identification of constrained cancer driver genes based on mutation timing.External Web Site Icon
Sakoparnig T, et al. PLoS Comput Biol. 2015 Jan 8;11(1):e1004027

CaMoDi: a new method for cancer module discovery.External Web Site Icon
Manolakos A, et al. BMC Genomics. 2014 Dec 12;15 Suppl 10:S8.

VHL, the story of a tumour suppressor gene.External Web Site Icon
Gossage L, et al. Nat Rev Cancer. 2014 Dec 23;15(1):55-64

Targeting the MET pathway for potential treatment of NSCLC.External Web Site Icon
Li A, et al. Expert Opin Ther Targets. 2014 Dec 23:1-12

Deciphering oncogenic drivers: from single genes to integrated pathways.External Web Site Icon
Chen J, et al. Brief Bioinform. 2014 Nov 5.

Driver and passenger mutations in cancer.External Web Site Icon
Pon JR, et al. Annu Rev Pathol. 2014 Oct 17

Hereditary Cancer Genetic Testing: Where are We? - December 18, 2014

NCI paper:Prevalence and correlates of receiving and sharing high-penetrance cancer genetic test results: Findings from the Health Information National Trends SurveyExternal Web Site Icon
Taber J.M. et al Public Health Genomics, January 2015

Clinical decisions: Screening an asymptomatic person for genetic risk--polling resultsExternal Web Site Icon
Schulte J, et al. N Engl J Med 2014 Nov;371(20):e30

Testing for hereditary breast cancer: Panel or targeted testing? Experience from a clinical cancer genetics practice.External Web Site Icon
Doherty J, J Genet Couns. 2014 Dec 5

Hereditary colorectal cancer syndromes: American Society of Clinical Oncology clinical practice guideline endorsement of the familial risk-colorectal cancer: European Society for Medical Oncology clinical practice guidelines.External Web Site Icon
Stoffel EM, et al. J Clin Oncol. 2014 Dec 1

Population testing for cancer predisposing BRCA1/BRCA2 mutations in the Ashkenazi-Jewish community: A randomized controlled trial.External Web Site Icon
Manchanda R, et al. J Natl Cancer Inst. 2014 Nov 30;107(1)

Cost-effectiveness of population screening for BRCA mutations in Ashkenazi Jewish women compared with family history-based testing.External Web Site Icon
Manchanda R et al. J Natl Cancer Inst. 2014 Nov 30;107(1). pii: dju380. doi: 10.1093/jnci/dju380. Print 2015 Jan.

Check out our Cancer Genetic Testing  Update Page for additional information and links

Cancer Genomic Tests (October 30, 2014)

Cancer Precision Medicine: Where Are We? - September 18, 2014

NIH announces the launch of 3 integrated precision medicine trials; ALCHEMIST is for patients with certain types of early-stage lung cancer,External Web Site Icon August 2014

National Cancer Institute's Precision Medicine Initiatives for the New National Clinical Trials Network.External Web Site Icon Jeffrey Abrams et al. ASCO Annual Meeting 2014

Personalized medicine: Special treatment.External Web Site Icon
Michael Eisenstein. Nature, September 11, 2014

Why the controversy? Start sequencing tumor genes at diagnosis. Tumor sequencing at the time of diagnosis can give significant insight for successful cancer treatment,External Web Site Icon by Shelly Gunn, Genetic Engineering & Biotechnology News, Sep 10

National Cancer Institute information: Precision medicine and targeted therapyExternal Web Site Icon

Genomics and precision oncology: What's a targeted therapy for cancer?External Web Site Icon An updated list of approved drugs from the National Cancer Institute (2014)

Therapy: This time it's personalExternal Web Site Icon
Gravitz L Nature 509, S52-S54 2014 May 29

Multi-marker solid tumor panels using next-generation sequencing to direct molecularly targeted therapiesExternal Web Site Icon
Michael Marrone, et al. PLoS Currents Evidence on Genomic Tests 2014 May 27

Impact of cancer genomics on precision medicine for the treatment of cancer,External Web Site Icon from the National Cancer Institute

Cancer genomics and precision medicine in the 21st century Adobe PDF file [PDF 2.20 MB]External Web Site Icon, power point presentation from the National Human Genome Research Institute


28

TCGA数据库的癌症种类以及癌症相关基因列表

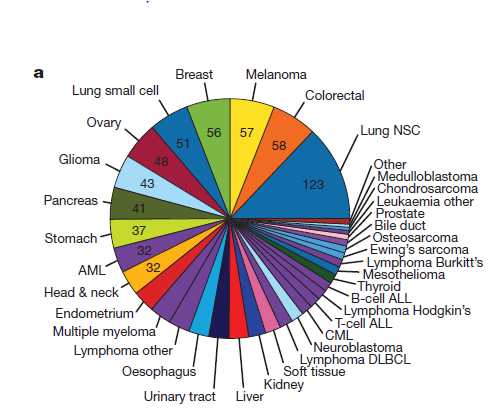
TCGA projects 里面包含的癌症种类非常多,但是我们分析数据时候常常用pan-cancer 12,pan-cancer 17,pan-cancer 21来表示数据集有多少种癌症,一般文献会给出癌症的简称或者全名:

BLCA, BRCA, COADREAD, GBM, HNSC, KIRC, LAML, LGG, LUAD, LUSC, OV, PRAD, SKCM, STAD, THCA, UCEC.

Acute myeloid leukaemia
Bladder
Breast
Carcinoid
Chronic lymphocytic leukaemia
Colorectal
Diffuse large B-cell lymphoma
Endometrial
Oesophageal adenocarcinoma
Glioblastoma multiforme
Head and neck
Kidney clear cell
Lung adenocarcinoma
Lung squamous cell carcinoma
Medulloblastoma
Melanoma
Multiple myeloma
Neuroblastoma
Ovarian
Prostate
Rhabdoid tumour

HCD features: download

这是高置信度的癌症驱动基因列表:共280多个基因
Cancer5000 features: download

这是一篇对接近5000个癌症样本的研究得到的癌症相关基因列表:共230多个基因

参考:http://bg.upf.edu/oncodrive-role/

http://bioinformatics.oxfordjournals.org/content/30/17/i549.full

http://www.nature.com/nature/journal/v505/n7484/full/nature12912.html?WT.ec_id=NATURE-20140123

28

TCGA年度研讨会资料分享

TCGA想必搞生信都或有耳闻,尤其是癌症研究方向的,共4个年度研讨会,主要是pdf格式的ppt分享,有需要的可以具体点击到页面一个个下载自己慢慢研究,也可以用我下面链接直接下载。

本来是有youtube分享演讲视频的,但是国内被墙了,大家就看看ppt吧

http://www.genome.gov/17516564

The Cancer Genome Atlas (TCGA) is a comprehensive and coordinated effort to accelerate our understanding of the molecular basis of cancer through the application of genome analysis technologies, including large-scale genome sequencing.

TCGA is a joint effort of the National Cancer Institute (NCI) and the National Human Genome Research Institute (NHGRI), which are both part of the National Institutes of Health, U.S. Department of Health and Human Services.

Meetings

pdf链接地址如下

http://www.genome.gov/Multimedia/Slides/TCGA1/TCGA1_.pdf

http://www.genome.gov/Multimedia/Slides/TCGA1/TCGA1_Laird.pdf

http://www.genome.gov/Multimedia/Slides/TCGA1/TCGA1_Durbin.pdf

http://www.genome.gov/Multimedia/Slides/TCGA1/TCGA1_Ley.pdf

http://www.genome.gov/Multimedia/Slides/TCGA1/TCGA1_Sartor.pdf

http://www.genome.gov/Multimedia/Slides/TCGA1/TCGA1_Ciriello.pdf

http://www.genome.gov/Multimedia/Slides/TCGA1/TCGA1_Imielinski.pdf

http://www.genome.gov/Multimedia/Slides/TCGA1/TCGA1_Gao.pdf

http://www.genome.gov/Multimedia/Slides/TCGA1/TCGA1_Carter.pdf

http://www.genome.gov/Multimedia/Slides/TCGA1/TCGA1_Ng.pdf

http://www.genome.gov/Multimedia/Slides/TCGA1/TCGA1_Parvin.pdf

http://www.genome.gov/Multimedia/Slides/TCGA1/TCGA1_Raphael.pdf

http://www.genome.gov/Multimedia/Slides/TCGA1/TCGA1_Lawrence.pdf

http://www.genome.gov/Multimedia/Slides/TCGA1/TCGA1_Kreisberg.pdf

http://www.genome.gov/Multimedia/Slides/TCGA1/TCGA1_Marra.pdf

http://www.genome.gov/Multimedia/Slides/TCGA1/TCGA1_Helman.pdf

http://www.genome.gov/Multimedia/Slides/TCGA1/TCGA1_Stuart.pdf

http://www.genome.gov/Multimedia/Slides/TCGA1/TCGA1_Cooper.pdf

http://www.genome.gov/Multimedia/Slides/TCGA1/TCGA1_Levine.pdf

http://www.genome.gov/Multimedia/Slides/TCGA1/TCGA1_Natsoulis.pdf

http://www.genome.gov/Multimedia/Slides/TCGA1/TCGA1_Haussler.pdf

http://www.genome.gov/Multimedia/Slides/TCGA1/TCGA1_Erkkila.pdf

http://www.genome.gov/Multimedia/Slides/TCGA1/TCGA1_Gehlenborg.pdf

http://www.genome.gov/Multimedia/Slides/TCGA1/TCGA1_Qiao.pdf

http://www.genome.gov/Multimedia/Slides/TCGA1/TCGA1_Sivachenko.pdf

http://www.genome.gov/Multimedia/Slides/TCGA1/TCGA1_Sumazin.pdf

http://www.genome.gov/Multimedia/Slides/TCGA1/TCGA1_Gutman.pdf

http://www.genome.gov/Multimedia/Slides/TCGA1/TCGA1_Mardis.pdf

http://www.genome.gov/Multimedia/Slides/TCGA2/01_Shaw.pdf

http://www.genome.gov/Multimedia/Slides/TCGA2/02_Chanock.pdf

http://www.genome.gov/Multimedia/Slides/TCGA2/03_Staudt.pdf

http://www.genome.gov/Multimedia/Slides/TCGA2/05_Creighton.pdf

http://www.genome.gov/Multimedia/Slides/TCGA2/06_Stojanov.pdf

http://www.genome.gov/Multimedia/Slides/TCGA2/07_Karchin.pdf

http://www.genome.gov/Multimedia/Slides/TCGA2/08_Mungall.pdf

http://www.genome.gov/Multimedia/Slides/TCGA2/09_Hakimi.pdf

http://www.genome.gov/Multimedia/Slides/TCGA2/10_Gao.pdf

http://www.genome.gov/Multimedia/Slides/TCGA2/11_Hayes.pdf

http://www.genome.gov/Multimedia/Slides/TCGA2/12_Troester.pdf

http://www.genome.gov/Multimedia/Slides/TCGA2/13_Knobluach.pdf

http://www.genome.gov/Multimedia/Slides/TCGA2/14_Raphael.pdf

http://www.genome.gov/Multimedia/Slides/TCGA2/15_Akbani.pdf

http://www.genome.gov/Multimedia/Slides/TCGA2/16_Giordano.pdf

http://www.genome.gov/Multimedia/Slides/TCGA2/17_Weinstein.pdf

http://www.genome.gov/Multimedia/Slides/TCGA2/18_Zheng.pdf

http://www.genome.gov/Multimedia/Slides/TCGA2/19_Getz.pdf

http://www.genome.gov/Multimedia/Slides/TCGA2/20_VanDneBroek.pdf

http://www.genome.gov/Multimedia/Slides/TCGA2/21_Liao.pdf

http://www.genome.gov/Multimedia/Slides/TCGA2/22_Khazanov.pdf

http://www.genome.gov/Multimedia/Slides/TCGA2/23_Levine.pdf

http://www.genome.gov/Multimedia/Slides/TCGA2/24_Miller.pdf

http://www.genome.gov/Multimedia/Slides/TCGA2/25_Ewing.pdf

http://www.genome.gov/Multimedia/Slides/TCGA2/26_Cirello.pdf

http://www.genome.gov/Multimedia/Slides/TCGA2/27_Verhaak.pdf

http://www.genome.gov/Multimedia/Slides/TCGA2/28_Hofree.pdf

http://www.genome.gov/Multimedia/Slides/TCGA2/29_Meyerson.pdf

http://www.genome.gov/Multimedia/Slides/TCGA2/30_Yang.pdf

http://www.genome.gov/Multimedia/Slides/TCGA2/31_Wheeler.pdf

http://www.genome.gov/Multimedia/Slides/TCGA2/32_Parfenov.pdf

http://www.genome.gov/Multimedia/Slides/TCGA2/33_Bernard-Rovira.pdf

http://www.genome.gov/Multimedia/Slides/TCGA2/34_Hast.pdf

http://www.genome.gov/Multimedia/Slides/TCGA2/36_Sellars.pdf

http://www.genome.gov/Multimedia/Slides/TCGA3/04_Brat.pdf

http://www.genome.gov/Multimedia/Slides/TCGA3/05_Mungall.pdf

http://www.genome.gov/Multimedia/Slides/TCGA3/06_Boutros.pdf

http://www.genome.gov/Multimedia/Slides/TCGA3/07_Zmuda.pdf

http://www.genome.gov/Multimedia/Slides/TCGA3/08_Benz.pdf

http://www.genome.gov/Multimedia/Slides/TCGA3/09_Zheng.pdf

http://www.genome.gov/Multimedia/Slides/TCGA3/11_Creighton.pdf

http://www.genome.gov/Multimedia/Slides/TCGA3/12_Aksoy.pdf

http://www.genome.gov/Multimedia/Slides/TCGA3/13_Dinh.pdf

http://www.genome.gov/Multimedia/Slides/TCGA3/14_Stuart.pdf

http://www.genome.gov/Multimedia/Slides/TCGA3/15_Amin.pdf

http://www.genome.gov/Multimedia/Slides/TCGA3/16_Gross.pdf

http://www.genome.gov/Multimedia/Slides/TCGA3/15_Akbani.pdf

http://www.genome.gov/Multimedia/Slides/TCGA3/18_Giordano.pdf

http://www.genome.gov/Multimedia/Slides/TCGA3/19_Amin-Mansour.pdf

http://www.genome.gov/Multimedia/Slides/TCGA3/20_Oesper.pdf

http://www.genome.gov/Multimedia/Slides/TCGA3/21_Gatza.pdf

http://www.genome.gov/Multimedia/Slides/TCGA3/22_Bernard.pdf

http://www.genome.gov/Multimedia/Slides/TCGA3/23_Sinha.pdf

http://www.genome.gov/Multimedia/Slides/TCGA3/24_Akbani.pdf

http://www.genome.gov/Multimedia/Slides/TCGA3/25_Watson.pdf

http://www.genome.gov/Multimedia/Slides/TCGA3/26_Martignetti.pdf

http://www.genome.gov/Multimedia/Slides/TCGA3/27_Bandlamudi.pdf

http://www.genome.gov/Multimedia/Slides/TCGA3/28_Fu.pdf

http://www.genome.gov/Multimedia/Slides/TCGA3/29_Akdemir.pdf

http://www.genome.gov/Multimedia/Slides/TCGA3/30_Bass.pdf

http://www.genome.gov/Multimedia/Slides/TCGA3/31_Hakimi.pdf

http://www.genome.gov/Multimedia/Slides/TCGA3/32_Wheeler.pdf

http://www.genome.gov/Multimedia/Slides/TCGA3/33_Lehmann.pdf

http://www.genome.gov/Multimedia/Slides/TCGA3/34_Gordenin.pdf

http://www.genome.gov/Multimedia/Slides/TCGA3/35_Wyczalkowski.pdf


http://www.genome.gov/Multimedia/Slides/TCGA4/02_Zenklusen.pdf

http://www.genome.gov/Multimedia/Slides/TCGA4/03_Hutter.pdf

http://www.genome.gov/Multimedia/Slides/TCGA4/04_Brat.pdf

http://www.genome.gov/Multimedia/Slides/TCGA4/05_Mungall.pdf

http://www.genome.gov/Multimedia/Slides/TCGA4/06_Linehan.pdf

http://www.genome.gov/Multimedia/Slides/TCGA4/07_Brooks.pdf

http://www.genome.gov/Multimedia/Slides/TCGA4/08_Wu.pdf

http://www.genome.gov/Multimedia/Slides/TCGA4/09_Giger.pdf

http://www.genome.gov/Multimedia/Slides/TCGA4/10_Wilkerson.pdf

http://www.genome.gov/Multimedia/Slides/TCGA4/11_Orsulic.pdf

http://www.genome.gov/Multimedia/Slides/TCGA4/12_Zhong.pdf

http://www.genome.gov/Multimedia/Slides/TCGA4/13_Knijnenburg.pdf

http://www.genome.gov/Multimedia/Slides/TCGA4/14_Akbani.pdf

http://www.genome.gov/Multimedia/Slides/TCGA4/15_Wang.pdf

http://www.genome.gov/Multimedia/Slides/TCGA4/16_Poisson.pdf

http://www.genome.gov/Multimedia/Slides/TCGA4/17_Alaeimahabadi.pdf

http://www.genome.gov/Multimedia/Slides/TCGA4/18_Noushmehr.pdf

http://www.genome.gov/Multimedia/Slides/TCGA4/19_Pantazi.pdf

http://www.genome.gov/Multimedia/Slides/TCGA4/20_Shih.pdf

http://www.genome.gov/Multimedia/Slides/TCGA4/21_Stransky.pdf

http://www.genome.gov/Multimedia/Slides/TCGA4/22_Giordano.pdf

http://www.genome.gov/Multimedia/Slides/TCGA4/23_Davidsen.pdf

http://www.genome.gov/Multimedia/Slides/TCGA4/24_Gross.pdf
 

28

R语言实现并行计算

前面我提到有一个大的运算任务需要很久才完成,所以用到了进度条来监控过程,但并不是改善了计算速度,所以需要用到并行计算,我又在网上找了找。

同样也是一个包,跟matlab的实现过程很像

library(parallel)

cl.cores <- detectCores() #检查当前电脑可用核数。

cl <- makeCluster(cl.cores) #使用刚才检测的核并行运算

#这里用clusterEvalQ或者par开头的apply函数族就可以进行并行计算啦

stopCluster(cl)

R-Doc里这样描述makeCluster函数:Creates a set of copies of R running in parallel and communicating over sockets. 即同时创建数个R进行并行运算。在该函数执行后就已经开始并行运算了,电脑可能会变卡一点。尤其在执行par开头的函数时。

在并行运算环境下,常用的一些计算方法如下:

1、clusterEvalQ(cl,expr)函数利用创建的cl执行expr。这里利用刚才创建的cl核并行运算expr。expr是执行命令的语句,不过如果命令太长的话,一般写到文件里比较好。比如把想执行的命令放在Rcode.r里:clusterEvalQ(cl,source(file="Rcode.r"))

2、par开头的apply函数族。这族函数和apply的用法基本一样,不过要多加一个参数cl。一般如果cl创建如上面cl <- makeCluster(cl.cores)的话,这个参数可以直接用作parApply(cl=cl,…)。当然Apply也可以是Sapply,Lapply等等。注意par后面的第一个字母是要大写的,而一般的apply函数族第一个字母不大写。

另外要注意,即使构建了并行运算的核,不使用parApply()函数,而使用apply()函数的话,则仍然没有实现并行运算。换句话说,makeCluster只是创建了待用的核,而不是并行运算的环境。

参考:http://www.r-bloggers.com/lang/chinese/1131

然后我模仿着用并行计算实现自己的需求

#it did work very fast
library(parallel)
cl.cores <- detectCores()
cl <- makeCluster(cl.cores)
clusterExport(cl, "all_dat_t")  #这里是重点,因为并行计算里面用到了自定义函数
clusterExport(cl, "all_prob_id") #但是这个函数需要用到这两个数据,所以需要把这两个数据加载到并行计算环境里面
prob_202723_s_at=parSapply( #我这里用的parSapply来实现并行计算
cl=cl,  #其中cl是我前面探测到的core数量,

deviation_prob, #deviation_prob是我待并行处理的向量

test_pro #这里其实应该是一个自定义函数,我这里就不写出来了,对上面的deviation_prob向量的每个探针都进行判断
)

28

R语言实现进度条

我也是临时在网上搜索到的教程,然后简单看了一下就实现了,其实就是就用到了一个名称为tcltk的包,直接查看函数tkProgressBar就可以知道怎么用啦!

下面是网上的一个小的示例代码(么有实际意义,仅为举例而已):

library(tcltk2)

u <- 1:2000

plot.new()

pb <- tkProgressBar("进度","已完成 %",  0, 100)

for(i in u) {

x<-rnorm(u)

points(x,x^2,col=i)

info <- sprintf("已完成 %d%%", round(i*100/length(u)))

setTkProgressBar(pb, i*100/length(u), sprintf("进度 (%s)", info), info)

}

close(pb)#关闭进度条

但是下面的代码是我模仿上面这个教程自己实现的。

[R]

# 以下是实现进度条
library(tcltk2)
plot.new()
pb <- tkProgressBar("进度","已完成 %", 0, 100)
prob_202723_s_at_value=rep(0,length(deviation_prob))
start_time=Sys.time() #这里可以计时,因为要实现进度条的一般都是需要很长运算时间
for (i in 1:length(deviation_prob)) {
tmp=test_pro(deviation_prob[i]) #test_pro是我自定义的一个函数,判断该探针是否符合要求。
if (length(tmp)!=0){prob_202723_s_at_value[i]=tmp}
info <- sprintf("已完成 %d%%", round(i*100/length(deviation_prob)))  #进度条就是根据循环里面的i来看看循环到哪一步了
setTkProgressBar(pb, i*100/length(deviation_prob), sprintf("进度 (%s)", info), info)
}
close(pb)#关闭进度条
end_time=Sys.time()
cat(end_time-start_time)

[/R]

28

R语言-比较数据框提取列的速度

结论:从数据框里面取某列数据,三种方法的时间消耗区别很大,直接用索引值,是最快的,而用$符号其次,用列名最慢。

我在R里面建立了一个表达量矩阵,列名是一个个样品,行是一个个探针,矩阵值是该探针在该样品测定的表达量。

那么,如果我要看看名为"202723_s_at"的探针的表达向量与其它所有探针的表达向量的相关系数,我可以用以下三种方法:

> system.time(apply(all_dat_t,2,function(x)  cor(all_dat_t$"202723_s_at",x)))

user  system elapsed

22.93    0.03   23.03

> system.time(apply(all_dat_t,2,function(x)  cor(all_dat_t[,"202723_s_at"],x)))

Timing stopped at: 92.02 5.32 97.66

太耗时间了,省去

> system.time(apply(all_dat_t,2,function(x)  cor(all_dat_t[,grep(prob,names(all_dat_t))],x)))

Timing stopped at: 13.55 0.04 13.66

> prob_num=grep(prob,names(all_dat_t))

> system.time(apply(all_dat_t,2,function(x)  cor(all_dat_t[,prob_num],x)))

user  system elapsed

8.14    0.01    8.17

可以看出,如果我首先根据探针名,grep出它在该表达量矩阵的列数,然后用列数来提取它的表达量是最快的,而且时间改善非常明显!

我们再探究一下cor函数的效率问题

探究的矩阵有54675个变量,每个变量均有189个观测值,如果取这个大矩阵的部分变量来求相关系数,结果如下!

> system.time(cor(all_dat_t[,1:10]))

user  system elapsed

0.001   0.000   0.001

> system.time(cor(all_dat_t[,1:100]))

user  system elapsed

0.003   0.000   0.003

> system.time(cor(all_dat_t[,1:1000]))

user  system elapsed

0.107   0.002   0.108

> system.time(cor(all_dat_t[,1:10000]))

user  system elapsed

11.102   0.849  11.983

> system.time(cor(all_dat_t)) 约六分钟也是可以搞定的

但是如果cor(all_dat_t),六分钟后得到的相关系数矩阵约32G,非常恐怖!

但是它很明显没有把这个32G相关系数矩阵存储到内存,因为我的机器本来就16G内存。我至今不能明白R具体实现机理


28

生信教程推荐-MSU的一个生信课程

http://angus.readthedocs.org/en/2014/index.html

Next-Gen Sequence Analysis Workshop (2014)

This is the schedule for the 2014 MSU NGS course.

This workshop has a Workshop Code of Conduct.

Download all of these materials or visit the GitHub repository.

Day Schedule
Monday 8/4
Tuesday 8/5
Wed 8/6
Thursday 8/7
Friday 8/8
Saturday 8/9
Monday 8/11
Tuesday 8/12
Wed 8/13
Thursday 8/14
Friday 8/15


27

根据基因表达量对样品进行分类ConsensusClusterPlus

bioconductor系列的包都是一样的安装方式:
source("http://bioconductor.org/biocLite.R")
biocLite("ConsensusClusterPlus")

这个包是我见过最简单的包, 加载只有做好输入数据,只需要一句话即可运行,然后默认输出所有结果

读这个包的readme,很容易学会
就是做好一个需要来进行分类的样品的表达量矩阵。或者选择上一篇日志用GEOquery这个包下载的表达量矩阵也可以进行分析
因为这个包是用ALL数据来做测试的,所以可以直接加载这个数据结果,这样就能得到表达矩阵啦
library(ALL)
data(ALL)
d=exprs(ALL)
d[1:5,1:5]
可以看到数据集如下

> d[1:5,1:5]

             01005    01010    03002    04006    04007
1000_at   7.597323 7.479445 7.567593 7.384684 7.905312
1001_at   5.046194 4.932537 4.799294 4.922627 4.844565
1002_f_at 3.900466 4.208155 3.886169 4.206798 3.416923
1003_s_at 5.903856 6.169024 5.860459 6.116890 5.687997
1004_at   5.925260 5.912780 5.893209 6.170245 5.615210
> dim(d)
[1] 12625   128
共128个样品,12625个探针数据
也有文献用RNAs-seq的RPKM值矩阵来做
对上面这个芯片表达数据我们一般会简单的进行normalization ,然后取在各个样品差异很大的那些gene或者探针的数据来进行聚类分析
mads=apply(d,1,mad)
d=d[rev(order(mads))[1:5000],]

d = sweep(d,1, apply(d,1,median,na.rm=T))

#也可以对这个d矩阵用DESeq的normalization 进行归一化,取决于具体情况
library(ConsensusClusterPlus)
#title=tempdir() #这里一般改为自己的目录
title="./" #所有的图片以及数据都会输出到这里的
results = ConsensusClusterPlus(d,maxK=6,reps=50,pItem=0.8,pFeature=1,
 title=title,clusterAlg="hc",distance="pearson",seed=1262118388.71279,plot="png")
这样就OK了,你指定的目录下面会输出大于9个图片

clipboard

大家看看说明书就知道这个包的输出文件是什么了。
很多参数都是需要调整的,一般我们的maxK=6是根据实验原理来调整,如果你的样品应该是要分成6类以上,那么你就要把maxK=6调到一点。
查看结果results[[2]][["consensusClass"] 可以看到各个样品被分到了哪个类别里面去
results[[3]][["consensusClass"]
results[[4]][["consensusClass"] 等等
27

从GEO数据库下载矩阵数据-可以直接进行下游分析

bioconductor系列的包都是一样的安装方式:
source("http://bioconductor.org/biocLite.R")
    biocLite("GEOquery")

以前GEO数据库主要是microarray的芯片数据,后来有了RNA-seq,如果同时做多个样品的RNA-seq,表达量矩阵后来也可以上传到GEO数据库里面,只有看到文献里面有提到GEO数据库,都可以通过这个R包俩进行批量下载,其实就是网页版的一个API调用而已:

GEO数据库里面有四种数据

At the most basic level of organization of GEO, there are four basic entity types.
 The first three (Sample, Platform, and Series) are supplied by users;
the fourth, the dataset, is compiled and curated by GEO sta from the user-submitted data.
GEO accession number (GPLxxx). 
GEO accession number (GSMxxx)
GEO accession number (GSExxx). 
GEO DataSets (GDSxxx)
记住大小关系:一个GDS可以有多个GSM,一个GSM可以有多个GSE,至于GPL,一般不接触的
我们通常接触的都是GSE系列(一个GSE里面有多个GSM)的数据,而且这个包最重要的就是一个getGEO函数。
只要你通过文献确定了你的检索号,就可以通过这个函数来下载啦
检索号一般是A character string representing a GEO object for download and
          parsing.  (eg., 'GDS505','GSE2','GSM2','GPL96'

这个函数有很多参数,除非你需要下载的文件,那么就设置destdir到你喜欢的目录,如果只需要表达量数据就不用了。

 getGEO(GEO = NULL, filename = NULL, destdir = tempdir(), GSElimits=NULL,
     GSEMatrix=TRUE,AnnotGPL=FALSE)
例如:
gds <- getGEO("GDS10") 会返回一个对象,而且下载数据一般会在tmp目录下面,当然如果你需要保存这些文件,你可以自己制定下载目录及文件名。
gse2553 <- getGEO("GSE2553")
GDS2eSet函数可以把上面这个下载函数得到的对象(要确定是GDS而不是GSE)变成表达对象
pData和exprs函数都可以处理上面这个表达对象,从而分别得到样品描述矩阵和样品表达量矩阵
综合一起就是
g4100 <- GDS2eSet(getGEO("GDS4100"))
g4102 <- GDS2eSet(getGEO("GDS4102"))
e4102<-exprs(g4102)
e4100<-exprs(g4100)
这样的代码,这个e4100和e4102就都是一个数值矩阵啦,可以进行下游分析,但是如果是下载的GSM数据
就用下面这个代码,GSE26253_series_matrix.txt是通过GSEMatrix=TRUE这个参数特意下载到你的目录的
expr_dat=read.table("GSE26253_series_matrix.txt",comment.char="!",stringsAsFactors=F)
这样读取也是一个数值矩阵
具体大家可以看这个包的说明书
#Download GDS file, put it in the current directory, and load it:
gds858 <- getGEO('GDS858', destdir=".")
如果使用了GSEMatrix=TRUE这个参数,那么除了下载soft文件,还有表达量矩阵文件,可以直接用read.table读取那个文件。
#Or, open an existing GDS file (even if its compressed):
gds858 <- getGEO(filename='GDS858.soft.gz')
下面这个下载的是GSE对象,GDS对象还有大一点
GEOquery-下载结果gds对象
06

hpv病毒研究调研

最新文献 http://www.ncbi.nlm.nih.gov/pubmed/26086163 上面有提到了hpv的研究现状

As of May 30, 2015, 201 different HPV types had been completely sequenced and officially recognized and divided into five PV-genera: Alpha-, Beta-, Gamma-, Mu-, and Nupapillomavirus.

根据文献,我找到了hpv所有已知测序种类的参考基因组网站:

http://www.hpvcenter.se/html/refclones.html

到目前(2015年7月31日15:17:59)已经有了205种,我爬取它们的genebank ID号,然后用python程序批量下载了它们的序列,能下载的序列共179条,都是8K左右的碱基序列。

image001

根据genebank ID或者其它ID号批量下载核酸序列的脚本如下:

[python]</pre>
import sys

import time

import random

from Bio import Entrez

ids=[]

infile=sys.argv[1]

for line in open(infile,'r'):

line=line.strip()

ids.append(line)

for i in range(1,len(ids)):

#       t = random.randrange(0,5)

handle =

Entrez.efetch(db="nucleotide", id=ids[i],rettype="fasta",email="jmzeng1314@163.com")

#       time.sleep(t)

print handle.read()

[/python]

脚本使用很简单,保持输入文件是一行一个ID号即可。

同时,根据文献我们也能得到hbv病毒提取方法

当然,我是看不懂的。

image003

同样的拿到下载的178条序列我们可以做一个进化树,当然,这个文章已经做好了,我就不做了,进化树其实蛮简单的。

下载179条hpv序列,每条序列都是8KB左右

我还用了R脚本批量下载

library(ape)

a=read.table("hpv_all.ID") #输入文件是一行一个ID号即可

for (i in 1:nrow(a)){

tmp=read.GenBank(a[i,1],seq.names = a[1,1],as.character = T)

write.dna(tmp,"tmp.fa",format="fasta", append=T,colsep = "")

}

然后用muscle做比对,参照我之前的笔记

http://www.bio-info-trainee.com/?p=659
http://www.bio-info-trainee.com/?p=660
http://www.bio-info-trainee.com/?p=626

muscle -in mouse_J.pro -out mouse_J.pro.a

muscle -maketree -in mouse_J.pro.a -out mouse_J.phy

貌似时间有点长呀,最后还莫名其妙的挂掉了,可能是我的服务器配置有点低。

image005

进化树如下所示:

image006


30

用perl把含有简并碱基的引物序列还原成多条序列

这篇博客的程序是错的,请看我最新博客:http://www.bio-info-trainee.com/1528.html

简并碱基对应表格如下;

R:ag
Y:CT
M:AC
K:GT
S:gc
W:AT
H:atc
B:gtc
V:gac
D:GAT
N:ATgc
把这个文本拷贝到txt文件里面保存好,或者直接写入hash里面也行!

[perl]

open FH,"ATCG.txt";

while(<FH>){

chomp;

@F=split/:/;

$hash{$F[0]}=uc $F[1];#右边就是简并表格

}

open FH1,"primer.txt";

while(<FH1>){

next if />/;

chomp;

primer2multiple($_); #对每个含有简并碱基的引物都进行以下函数处理

}

sub primer2multiple{

$primer=$_[0];

$prod=1;

$primer_len=length $primer ;

foreach $i (0..$primer_len-1){

$char=substr($primer,$i,1);

if ($char !~/[ATCG]/){$prod*=length $hash{$char}}

}

$new="";

foreach $i (0..$primer_len-1){

$char=substr($primer,$i,1);

if ($char =~/[ATCG]/){$new.=$char x $prod}

else {$tmp=length $hash{$char};$new.=$hash{$char} x ($prod/$tmp)}

}

die "error!" if   $primer_len*$prod != length $new ;

foreach $i (0..$prod-1){

$tmp="";

for(my $j=$i;$j<(length($new));$j+=$prod){$tmp.=substr($new,$j,1)}

print "$tmp\n";

}

}

[/perl]

可以直接调用这个函数即可primer2multiple('ATGCVHGT');

就可以看到简并碱基被替换啦,就是那个V和H


ATGCGAGT
ATGCATGT
ATGCCCGT
ATGCGAGT
ATGCATGT
ATGCCCGT
ATGCGAGT
ATGCATGT
ATGCCCGT

30

perl用递归法得到允许多个错配的模式匹配

如果我要匹配一个字符串$a="ATTCCGGGAT";那么直接在shell里面grep它即可,写脚本也行$seq =~ /$a/;,但是如果我想查找这个字符串的模糊匹配,允许一个错配的情况,那么就非常多了!这时候简单的匹配已经不能达到目的,但是我们仍然可以用perl强大的正则匹配功能达到目的。

比如,它的匹配模式应该:

/.TTCCGGGAT/

/A.TCCGGGAT/

/AT.CCGGGAT/等等,可以把这些模式都综合起来就是下面这个

$b=(?^:(?:A(?:T(?:T(?:C(?:C(?:G(?:G(?:G(?:A.|.T)|.AT)|.GAT)|.GGAT)|.GGGAT)|.CGGGAT)|.CCGGGAT)|.TCCGGGAT)|.TTCCGGGAT))

所以我们就应该通过程序来生成这个字符串,然后用

$seq =~ /$b/;来替代$seq =~ /$a/;

而允许两个错配的格式就更复杂了:

(?^:(?:A(?:T(?:T(?:C(?:C(?:G(?:G(?:G..|.(?:A.|.T))|.(?:G(?:A.|.T)|.AT))|.(?:G(?:G(?:A.|.T)|.AT)|.GAT))|.(?:G(?:G(?:G(?:A.|.T)|.AT)|.GAT)|.GGAT))|.(?:C(?:G(?:G(?:G(?:A.|.T)|.AT)|.GAT)|.GGAT)|.GGGAT))|.(?:C(?:C(?:G(?:G(?:G(?:A.|.T)|.AT)|.GAT)|.GGAT)|.GGGAT)|.CGGGAT))|.(?:T(?:C(?:C(?:G(?:G(?:G(?:A.|.T)|.AT)|.GAT)|.GGAT)|.GGGAT)|.CGGGAT)|.CCGGGAT))|.(?:T(?:T(?:C(?:C(?:G(?:G(?:G(?:A.|.T)|.AT)|.GAT)|.GGAT)|.GGGAT)|.CGGGAT)|.CCGGGAT)|.TCCGGGAT)))

[perl]

$a="ATTCCGGGAT";
$one_match=fuzzy_pattern($a,1);
print "$one_match\n";

sub fuzzy_pattern {
my ($original_pattern, $mismatches_allowed) = @_;
$mismatches_allowed >= 0
or die "Number of mismatches must be greater than or equal to zero\n";
my $new_pattern = make_approximate($original_pattern, $mismatches_allowed);
return qr/$new_pattern/;
}
sub make_approximate {
my ($pattern, $mismatches_allowed) = @_;
if ($mismatches_allowed == 0) { return $pattern }
elsif (length($pattern) <= $mismatches_allowed)
{ $pattern =~ tr/ACTG/./; return $pattern }
else {
my ($first, $rest) = $pattern =~ /^(.)(.*)/;
my $after_match = make_approximate($rest, $mismatches_allowed);
if ($first =~ /[ACGT]/) {
my $after_miss = make_approximate($rest, $mismatches_allowed-1);
return "(?:$first$after_match|.$after_miss)";
}
else { return "$first$after_match" }
}
}

[/perl]

只需要控制$one_match=fuzzy_pattern($a,1);里面的参数即可控制自己想要的匹配情况。

然后把生成的匹配模式用了进行序列匹配$seq =~ /$one_mismatch/;

这个程序的重点就是解析需要生成的匹配字符串规则,然后用递归来生成这个匹配字符串。

这种匹配,在引物搜索特别有用。

24

perl多重循环生成全排列精简

我想输出ATCG四个字符,组成一个12个字符长度字符串的全排列。共4^12=16777216种排列,

AAAAAAAAAAAA

AAAAAAAAAAAT

AAAAAAAAAAAC

AAAAAAAAAAAG

AAAAAAAAAATA

`````````````````````````

按照正常的想法是通过多重循环来生成全排列,所以我写下了下面这样的代码,但是有个问题,它不支持多扩展性,如果100个全排列,那么得写一百次循环嵌套。

4

所以我求助了perl-china群里的高手,其中一个给了一个结合二进制的巧妙解决方案。

perl -le '{$a{"00"}="A";$a{"01"}="T";$a{"10"}="C";$a{"11"}="G";for(0..100){print join"",map{$a{$_}} unpack("a2"x12,sprintf("%024b\n",$_))}}'

AAAAAAAAAAAA

AAAAAAAAAAAT

AAAAAAAAAAAC

AAAAAAAAAAAG

AAAAAAAAAATA

AAAAAAAAAATT

AAAAAAAAAATC

AAAAAAAAAATG

AAAAAAAAAACA

AAAAAAAAAACT

AAAAAAAAAACC

AAAAAAAAAACG

AAAAAAAAAAGA

AAAAAAAAAAGT

AAAAAAAAAAGC

AAAAAAAAAAGG

AAAAAAAAATAA

AAAAAAAAATAT

这里我简单解释一下这个代码

perl -le '{$a=sprintf("%024b\n",1);print $a}'

000000000000000000000001

这个sprintf是根据024b的格式把我们的十进制数字转为二级制,但是补全为24位。

perl -le '{@a=unpack("a2"x12,sprintf("%024b\n",100));print join":", @a}'

00:00:00:00:00:00:00:00:01:10:01:00

unpack这个函数很简单,就是把二进制的数值拆分成字符串数组,两个数字组成一个字符串。

最后通过map把$a{"00"}="A";$a{"01"}="T";$a{"10"}="C";$a{"11"}="G";对应成hash值并且输出即可!

然后这个大神又提成了一个递归的办法来解决

[perl]

#!/usr/bin/perl

my $arr = [];

$arr->[$_] = 0 for (0..11);
my @b = ("A","C","G","T");

while(1){
print join "", map {$b[$_]} @$arr;
print "\n";
exit unless &count($arr,11);
}

sub count {
my $arr = shift;
my $x = shift;

return 0 if $x < 0;

if ($arr->[$x] < 3){
$arr->[$x]++;
return 1;
}

else{
$arr->[$x] = 0;
return &count($arr,$x - 1);
}
}

[/perl]

还有另外一个大神也提成了一个递归的算法解决,算法之道还是蛮有趣的

2

最后还补充一个也是计算机技巧的解决方案,也是群里的朋友提出来的。

[perl]

#!/usr/bin/perl -w

my @A = qw(A T G C);
my $N = 12;

foreach my $n (0..4**$N){
foreach my $index (0..$N){
print $A[$n%4];
$n = $n >>2;
}
print "\n";
}

[/perl]

这个是位运算,如果C语言基础学的好的同学很快就能看懂的。


21

生信工作者基础知识一

xshell破解码和editplus破解码,ultraISO注册码

强烈推荐xshell安装,及破解网上找的一个注册码:101210-450789-147200

强烈editplus或者notepad++,搜索注册码是

注册名:Free User

注册码:6AC8D-784D8-DDZ95-B8W3A-45TFA

强烈建议大家玩一玩双系统制作ubuntu12.4版本的安装U盘,下载ultraISO,注册码为:王涛7C81-1689-4046-626F


如何正确删除双系统的unix系统

肯定有很多人玩过了双系统就烦了,麻烦的是如何删除呢?

重点是需要修复MBR

1.进入win7,下载个软件MbrFix,放在C:\windows\system32文件夹中

2.点击开始》所有程序》附件》命令提示符

3.在命令提示符中输入MbrFix /drive 0 fixmbr /yes

image001

4.此时已经修复了MBR,重启电脑后会发现已经没有了linux启动选项,直接进入windows了


如何在window系统下查看当前电脑双系统中另一个系统的磁盘内容。

这个需求很常见,因为双系统linux是可以看window的内容,但是window却无法直接查看linux内容。

下载ext2fsd可以把双系统里面linux分区的ext硬盘里面的文件通过window平台读取出来,软件下载地址如下

http://sourceforge.net/projects/ext2fsd/files/latest/download

image002

21

R语言用hclust进行聚类分析

聚类的基础就是算出所有元素两两间的距离,我们首先做一些示例数据,如下:

x=runif(10)

y=runif(10)

S=cbind(x,y)                                 #得到2维的数组

rownames(S)=paste("Name",1:10,"")             #赋予名称,便于识别分类

out.dist=dist(S,method="euclidean")           #数值变距离

这个代码运行得到的S是一个矩阵,如下

> S

x         y

Name 1   0.41517985 0.4697017

Name 2   0.35653781 0.1132367

Name 3   0.52253349 0.3680286

Name 4   0.80558684 0.9834687

Name 5   0.04564145 0.8560690

Name 6   0.11044397 0.2988598

Name 7   0.34984447 0.8515141

Name 8   0.28097709 0.1260050

Name 9   0.81771888 0.5976135

Name 10 0.40700158 0.5236567

可以看出里面共有10个点,它们的X,Y坐标均已知,我们有6总方法可以求矩阵

image001

注释:在聚类中求两点的距离有:

1,绝对距离:manhattan

2,欧氏距离:euclidean 默认

3,闵科夫斯基距离:minkowski

4,切比雪夫距离:chebyshev

5,马氏距离:mahalanobis

6,蓝氏距离:canberra

用默认的算法求出距离如下

算出距离后就可以进行聚类啦!

out.hclust=hclust(out.dist,method="complete") #根据距离聚类

注释:聚类也有多种方法:

1,类平均法:average

2,重心法:centroid

3,中间距离法:median

4,最长距离法:complete 默认

5,最短距离法:single

6,离差平方和法:ward

7,密度估计法:density

接下来把聚类的结果图画出来

plclust(out.hclust)                           #对结果画图

image003

rect.hclust(out.hclust,k=3)                   #用矩形画出分为3类的区域

image005

out.id=cutree(out.hclust,k=3)                 #得到分为3类的数值

这里的out.id就是把每个点都分类了的分类数组,1,2,3.


21

用R语言批量做T检验

需要做T检验的的数据如下:其中加粗加黑的是case,其余的是control,需要进行检验的是

p_ma    p_mg    p_ag    p_mag 这四列数据,在case和control里面的差异,当然用肉眼很容易看出,control要比case高很多


individual m a g ma mg ag mag p_ma p_mg p_ag p_mag
HBV10-1 33146 3606 2208 308 111 97 39 0.79% 0.29% 0.25% 0.10%
HBV15-1 23580 10300 3140 1469 598 560 323 4.19% 1.71% 1.60% 0.92%
HBV3-1 107856 26445 15077 4773 2383 1869 1130 3.34% 1.67% 1.31% 0.79%
HBV4-1 32763 6448 4384 579 291 295 124 1.35% 0.68% 0.69% 0.29%
HBV6-1 122396 6108 7953 911 796 347 144 0.67% 0.59% 0.26% 0.11%
IGA-1 31337 22167 14195 3851 2752 4101 2028 6.50% 4.65% 6.92% 3.42%
IGA-10 6713 9088 12801 2275 2470 4284 1977 10.54% 11.44% 19.85% 9.16%
IGA-11 61574 23622 15076 5978 4319 3908 2618 6.71% 4.84% 4.38% 2.94%
IGA-12 38510 23353 20148 6941 6201 6510 4328 10.38% 9.27% 9.73% 6.47%
IgA-13 155379 81980 65315 26055 20085 17070 10043 10.38% 8.00% 6.80% 4.00%
IgA-14 345430 86462 71099 27541 21254 10923 6435 6.06% 4.67% 2.40% 1.42%
IgA-15 3864 3076 1942 378 207 389 145 4.66% 2.55% 4.80% 1.79%
IgA-16 3591 4106 2358 427 174 424 114 4.64% 1.89% 4.61% 1.24%
IgA-17 893 1442 799 68 28 78 18 2.27% 0.94% 2.61% 0.60%
IGA-2 23097 5083 5689 910 951 1173 549 2.89% 3.02% 3.72% 1.74%
IGA-3 14058 9364 8565 2130 1953 2931 1436 8.03% 7.36% 11.05% 5.41%
IGA-4 81571 36894 33664 11346 10131 9908 6851 8.86% 7.91% 7.74% 5.35%
IGA-5 27626 6492 4503 963 752 942 410 2.64% 2.06% 2.58% 1.12%
IGA-7 55348 5956 4028 833 476 468 207 1.30% 0.74% 0.73% 0.32%
IGA-8 31671 17097 10443 3894 2666 3514 2003 7.56% 5.17% 6.82% 3.89%


但是我们需要写程序对这些百分比在case和control里面进行T检验。

a=read.table("venn_dat.txt",header=T)

type=c(rep("control",5),rep("case",12),"control","control","case")

for (i in 9:12)

{

dat=as.numeric(unlist(lapply(a[i],function(x) strsplit(as.character(x),"%"))))

filename=paste(names(a)[i],".png",sep="")

png(file=filename, width = 320, height = 360)

b=t.test(dat~type)

txt=paste("p-value=",round(b$p.value[1],digits=4),sep="")

plot(as.factor(type),dat,ylab="percent(%)",main=names(a)[i],sub=txt,cex.axis=1.5,cex.sub=2,cex.main=2,cex.lab=1.5)

dev.off()

}

得到的图片如下:

image008

21

用R语言批量画韦恩图

需要画韦恩图的文件如下所示:

#CDR3_aa    count_all    count_IgM    count_IgA    count_IgG
CARGVDAGVDYW    243    25    196    22
CARHPRNYGNFDYW    174    171    3    0
CARENTMVRGVINPLDYW    166    8    75    83
CAREASDSISNWDDWYFDLW    129    15    114    0
CARDPDNSGAFDPW    118    1    117    0
CAKDLGGYW    98    3    4    91
CAREVADYDTYGWFLDLW    95    26    68    1
CVRNRGFFGLDIW    82    0    1    81
CARRSTNYHGWDYW    80    3    2    74

此处省略一万行。

简单解释一下数据,第一列是CDR3序列,我们需要对count_IgM    count_IgA    count_IgG这三列数据进行画韦恩图,数字大于0代表有,数字为0代表无。

这样我们根据序列就能得出每列数据所有的CDR3序列,即不为0的CDR3序列

每个个体都会输出一个统计文件,共20个文件需要画韦恩图

image005

对这个统计文件就可以进行画韦恩图。

画韦恩图的R代码如下:

library(VennDiagram)

files=list.files(path = ".", pattern = "type")

for (i in files){

a=read.table(i)

individual=strsplit(i,"\\.")[[1]][1]

image_name=paste(individual,".tiff",sep="")

IGM=which(a[,3]>0)

IGA=which(a[,4]>0)

IGG=which(a[,5]>0)

venn.diagram(list(IGM=IGM,IGA=IGA,IGG=IGG), fill=c("red","green","blue"), alpha=c(0.5,0.5,0.5), cex=2, cat.fontface=4, fontfamily=3, filename=image_name)

}

image007

但事实上,这个韦恩图很难表现出什么,因为我们的每个个体的count_IgM    count_IgA    count_IgG总数不一样。